

Energy
ENERGY
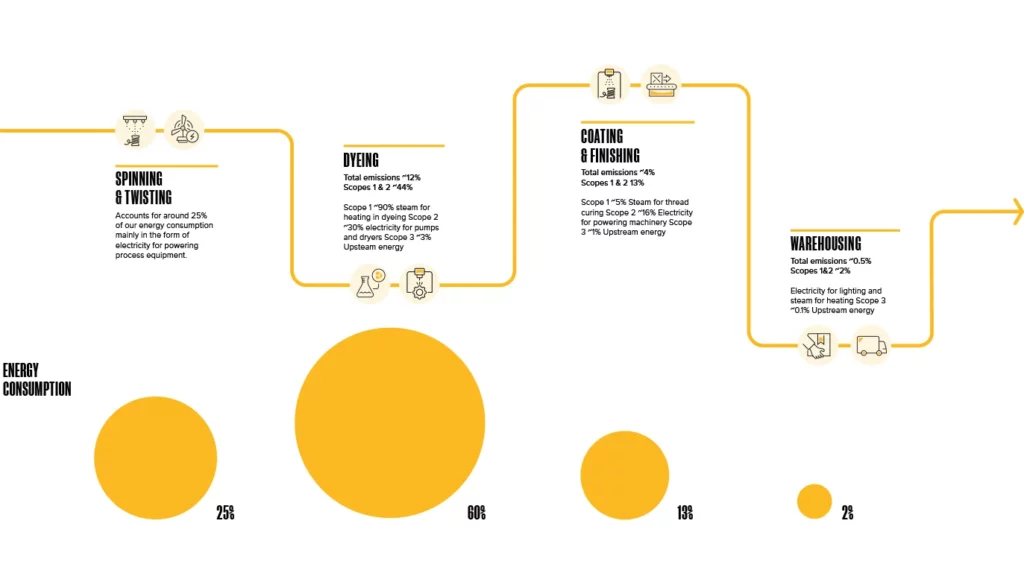
Our Energy Profile
Use of Smart Metering to Deliver Data Driven Insights and Actions on Energy
 “As Engineering Manager of our Shenzhen manufacturing facility in South China, I have led the local ESG Utilities programme where we initiated real-time streaming of energy data into a cloud based platform. This has enabled us to much better understand energy usage patterns and identify previously hidden opportunities for delivery of energy efficiency improvements.
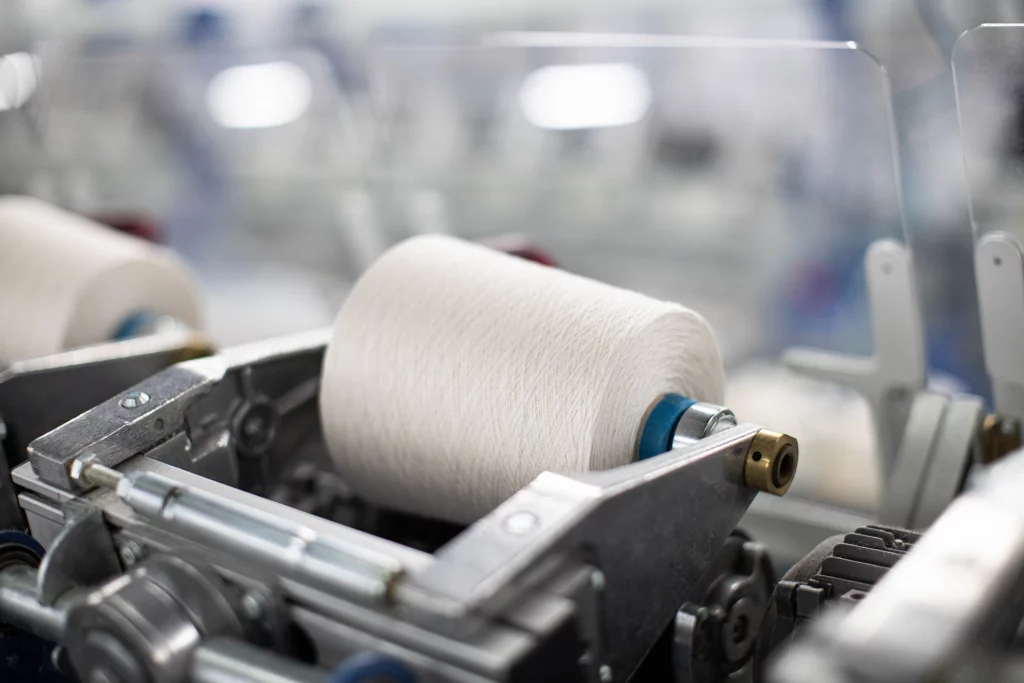
After our dyeing process, we dry the thread before processing into finished goods for sale to our customers. The drying process involves two stages; the first being water removal through a centrifugal extraction process, followed by a radiofrequency drying process where remaining water is driven off by targeting the vibrational wavelengths of remaining water molecules.
Using the streamed smart energy data from these two processes, we were able for the first time to review the entire drying process holistically, and the new transparency enabled our Six Sigma continuous improvement team to optimise the overall process through nominal energy increases in the centrifugal extraction process and significant reductions in the radio-frequency process, delivering a notable 15% end to end process energy reduction. The additional transparency that has come from increased granularity data has really helped us identify new areas of opportunity.”
Pele Tang
Engineering Manager, Shenzhen
Coats Energy Profile
Through 2022, as part of our global Cleaner and Lighter program, we further embedded our energy management platform with extended use of realtime smart energy meter data being streamed into our cloud based utilities management system. This new capability has enabled a far greater level of energy metering across operating units, giving heightened granularity and transparency of energy consumption at departmental, work centre and individual machine level and using data driven decision making has aided identification of new actionable insights to increase energy efficiency. Examples of improvement areas identified through this initiative were powering down of stand-by boilers, optimisation of frequency of air humidification systems in Spinning and Twisting operations, optimisation of compressed air and steam pressure and leak identification and remediation, campaigns to optimise asset utilisation in our thread bonding lines and optimisation of site level transformer loading. Across numerous facilities, we had active engagement from across the entire workforce with teams competing to identify and deliver energy reductions across production, dormitory and canteen facilities. Our Environmental and Climate Change Policies cover our energy and emissions aims and objectives.
Energy: 22% reduction in Scopes 1&2 CO2e emissions
|
Indicator
|
Unit | 2022* | 2021 restated1 | 2021 | 2020 restated1 | 2020 | 2019 restated1 | 2019 | 2018 restated1 | 2018 |
|---|---|---|---|---|---|---|---|---|---|---|
|
Total energy used in operations
|
Million kWh | 692 | 792 | 801 | 661 | 670 | 826 | 831 | 858 | 865 |
|
Energy intensity
|
kWh/kg produced | 8.2 | 8.5 | 8.6 | 8.9 | 9.1 | 9.1 | 9.4 | 9.1 | 9.3 |
|
Energy intensity movement compared to 2018
|
% movement | -10% | -7% | -7% | -3% | -2% | 0% | 1% | ||
|
Non-renewable electricity used
|
% | 25% | 28% | 32% | 29% | 32% | 28% | 34% | 27% | 32% |
|
Natural gas used
|
% | 33% | 34% | 31% | 33% | 30% | 32% | 28% | 33% | 29% |
|
Oil used
|
% | 3% | 4% | 4% | 4% | 4% | 5% | 4% | 5% | 5% |
|
Coal used
|
% | 0% | 0% | 0% | 0% | 0% | 0% | 0% | 0% | 0% |
|
Renewable energy used
|
% | 38% | 34% | 34% | 34% | 33% | 35% | 34% | 34% | 34% |
|
% Electricity covered by renewable certificates
|
% | 25% | 7% | 7% | 8% | 6% | 7% | 5% | 5% | 3% |
|
Total carbon footprint,
Scopes 1, 2 & 3² |
Thousand tonnes CO2e | 985.2 | 1,157.0 | 900.7 | 1,123.1 | 303 | ||||
|
Scopes 1 & 2 footprint2
|
Thousand tonnes CO2e | 207.6 | 246.8 | 253.4 | 212.8 | 217.2 | 269.2 | 273.8 | 303.3 | |
|
Scope 1 emissions footprint³
|
Thousand tonnes CO2e | 50.0 | 58.2 | 62.7 | 48.7 | 51.3 | 62.26 | 64.6 | 67.1 | |
|
Scope 1 CO2 emissions
|
Tonnes CO2 | 48,585 | 56,925 | 60,106 | 46935 | 49,743 | 60789 | 63,153 | ||
|
Scope 1 CH4 emissions
|
Tonnes CH4 | 66.7 | 78.5 | 82.8 | 63.68 | 67.2 | 80.7 | 83.7 | ||
|
Scope 1 N2O emissions
|
Tonnes N2O | 52.7 | 56.6 | 58.4 | 45.86 | 47.3 | 75.2 | 76.6 | ||
|
Scope 1 HFCs emissions
|
Tonnes HFCs | 1,159.8 | 1,174.8 | 2,476.8 | 1470 | 1,494.5 | 1317 | 1,339.2 | ||
|
Scope 1 PFCs emissions
|
Tonnes PFCs | 0 | 0 | 0.0 | 0 | 0.0 | 0 | 0.0 | ||
|
Scope 1 SF6 emissions
|
Tonnes SF6 | 0 | 0 | 0.0 | 0 | 0.0 | 0 | 0.0 | ||
|
Scope 1 NF3 emissions
|
Tonnes NF3 | 0 | 0 | 0.0 | 0 | 0.0 | 0 | 0.0 | ||
|
Scope 2 emissions footprint (location based)⁴
|
Thousand tonnes CO2e | 195.8 | 213.9 | 216.1 | 184.3 | 186.2 | 232.9 | 235.3 | 236.2 | |
|
Scope 2 CO2 emissions
|
Tonnes CO2 | 194,754 | 212,741 | 214,905 | 183,278 | 185,116 | 231,625 | 233,974 | ||
|
Scope 2 CH4 emissions
|
Tonnes CH4 | 216 | 232 | 234 | 214 | 216 | 275 | 277 | ||
|
Scope 2 N2O emissions
|
Tonnes N2O | 815 | 944 | 948 | 829 | 833 | 1,043 | 1,047 | ||
|
Scope 2 emissions footprint (market based)⁵
|
Thousand tonnes CO2e | 157.6 | 188.6 | 190.7 | 164.1 | 165.9 | 206.9 | 209.2 | ||
|
Scope 2 CO2 emissions
|
Tonnes CO2 | 156,004 | 186,503 | 188,666 | 162,323 | 164,160 | 204,510 | 206,858 | ||
|
Scope 2 CH4 emissions
|
Tonnes CH4 | 114.6 | 126.6 | 128.7 | 128.1 | 129.9 | 153.8 | 155.8 | ||
|
Scope 2 N2O emissions
|
Tonnes N2O | 671.6 | 585.2 | 589.3 | 526.3 | 529.8 | 622.7 | 626.8 | ||
|
Out-of-scope biofuels, Scope 2 CO2 emissions
|
Tonnes CO2 | 19,900.0 | 32,789.0 | 32,789.0 | 26,960.0 | 26,960.0 | 38,163.0 | 38,163.0 | ||
|
% scope 2 emissions covered by renewable certificates
|
% | 25% | 8% | 7% | 6% | 6% | 5% | 5% | 4% | |
|
Emissions volume intensity (location based)
|
CO2e kg/kg production | 2.9 | 2.9 | 2.7 | 3.1 | 3.1 | 3.3 | 3.0 | 3.1 | |
|
Emissions value intensity (location based)
|
CO2e tonnes/$m sales | 154 | 188 | 176 | 209 | 202 | 223 | 185 | 192 | |
|
Scope 3 emissions footprint⁶
|
Thousand tonnes CO2e | 777.6 | 891.3 | 671.0 | 849.2 | |||||
|
Scope 3 CO2 emissions
|
Tonnes CO2 | 641,210 | 738,782 | 579,979 | 722,740 | |||||
|
Scope 3 CH4 emissions
|
Tonnes CH4 | 7,589 | 7,106 | 4,419 | 6,748 | |||||
|
Scope 3 N2O emissions
|
Tonnes N2O | 26,128 | 31,994 | 23,590 | 30,525 |
1Due to the sale of our Brazilian and Argentinian businesses in 2022 all years from 2018 to 2022 have been restated to exclude these businesses.
*2022 Data – All data excludes Brazil/Argentina, except emissions data, H&S data and economic value data.
2Total carbon footprint includes Scope 3 from 2019 and include market based Scope 2 from 2019. Prior years only include scopes 1 & 2 and location based for Scope 2. The boundary methodology for our emissions is based on financial control for all companies that are consolidated in the company financial statements and equity share for 2 joint venture operations.
3Scope 1 methodology – Fuel consumption data is collected from all units monthly, based on metred or invoiced consumption coverted into kWh. This is converted into emissions using DEFRA gross calorific value conversion factors published each year. This is then consolidated as per the boundary methodology.
4Scope 2 Location based methodology. Electricity or steam purchase volumes are collected from all units monthly in kWh. For location based calculations, all electricity kWhs are converted using IEA country level conversion factors for the year in question, and purchased steam or heating is converted using DEFRA conversion factors for the year in question. Data is then consolidated using the boundary methodology explained in note 2.
5Scope 2 Market based methodology. Electricity or steam purchase volumes are collected from all units monthly in kWh. For market based calculations, electricity kWhs that are covered by energy attribute certificates directly from suppliers or purchased on official markets are removed and the remainder are converted using supplier level conversion factors, if available or IEA country level conversion factors for the year in question. Purchased steam or heating is converted using DEFRA conversion factors for the year in question except for biogenic steam volumes where the CO₂ component of the emissions is removed and reported separately. Data is then consolidated using the boundary methodology explained in note 2.
6Scope 3 methodology. Scope 3 emissions are calculated annually using multiple sources for data (base activity data comes from internal data sources and conversion factors are generated from various sources, including suppliers, life cycle assessment data providers and industry data sources). The most critical data, covering primary raw materials, is largely sourced from suppliers. Each Scope 3 category is calculated with the best available set of data sources, and is consistent over the 3 reported years in this table.
For more information on our historical performance, please download Performance Summary Data
Energy: 22% reduction in Scopes 1&2 CO2e emissions
|
Indicator
|
Unit | 2017 | 2016 | 2015 | 2014 |
|---|---|---|---|---|---|
|
Total energy used in operations
|
Million kWh | 823 | 829 | 833 | 858 |
|
Energy intensity
|
kWh/kg produced | 11.5 | 11.9 | 12.2 | 13.2 |
|
Non-renewable electricity used
|
% | 29% | 30% | 32% | 31% |
|
Natural gas used
|
% | 34% | 35% | 33% | 33% |
|
Oil used
|
% | 7% | 6% | 6% | 11% |
|
Coal used
|
% | 0% | 0% | 0% | 0% |
|
Renewable energy used
|
% | 30% | 29% | 29% | 25% |
|
Total carbon footprint,
Scopes 1, 2 & 3² |
Thousand tonnes CO2e | 311 | 319 | 305 | 322 |
|
Scopes 1 & 2 footprint2
|
Thousand tonnes CO2e | 310.6 | 318.5 | 305.4 | 321.9 |
|
Scope 1 emissions footprint³
|
Thousand tonnes CO2e | 71.8 | 70.9 | 67.8 | 81.5 |
|
Scope 2 CO2 emissions
|
Tonnes CO2 | 238.8 | 247.6 | 237.6 | 240.4 |
|
Emissions volume intensity (location based)
|
CO2e kg/kg production | 4.3 | 4.6 | 4.5 | 4.9 |
|
Emissions value intensity (location based)
|
CO2e tonnes/$m sales | 206 | 219 | 208 | 210 |
1Due to the sale of our Brazilian and Argentinian businesses in 2022 all years from 2018 to 2022 have been restated to exclude these businesses.
*2022 Data – All data excludes Brazil/Argentina, except emissions data, H&S data and economic value data.
2Total carbon footprint includes Scope 3 from 2019 and include market based Scope 2 from 2019. Prior years only include scopes 1 & 2 and location based for Scope 2. The boundary methodology for our emissions is based on financial control for all companies that are consolidated in the company financial statements and equity share for 2 joint venture operations.
3Scope 1 methodology – Fuel consumption data is collected from all units monthly, based on metred or invoiced consumption coverted into kWh. This is converted into emissions using DEFRA gross calorific value conversion factors published each year. This is then consolidated as per the boundary methodology.
4Scope 2 Location based methodology. Electricity or steam purchase volumes are collected from all units monthly in kWh. For location based calculations, all electricity kWhs are converted using IEA country level conversion factors for the year in question, and purchased steam or heating is converted using DEFRA conversion factors for the year in question. Data is then consolidated using the boundary methodology explained in note 2.
For more information on our historical performance, please download Performance Summary Data