

Waste
WASTE
We produce solid and liquid waste in our processes. Through all our processes we need to ensure that we recover as much material as possible from waste streams and that we are then ensuring that any residual waste product is dealt with responsibly and with the smallest impact on the environment.
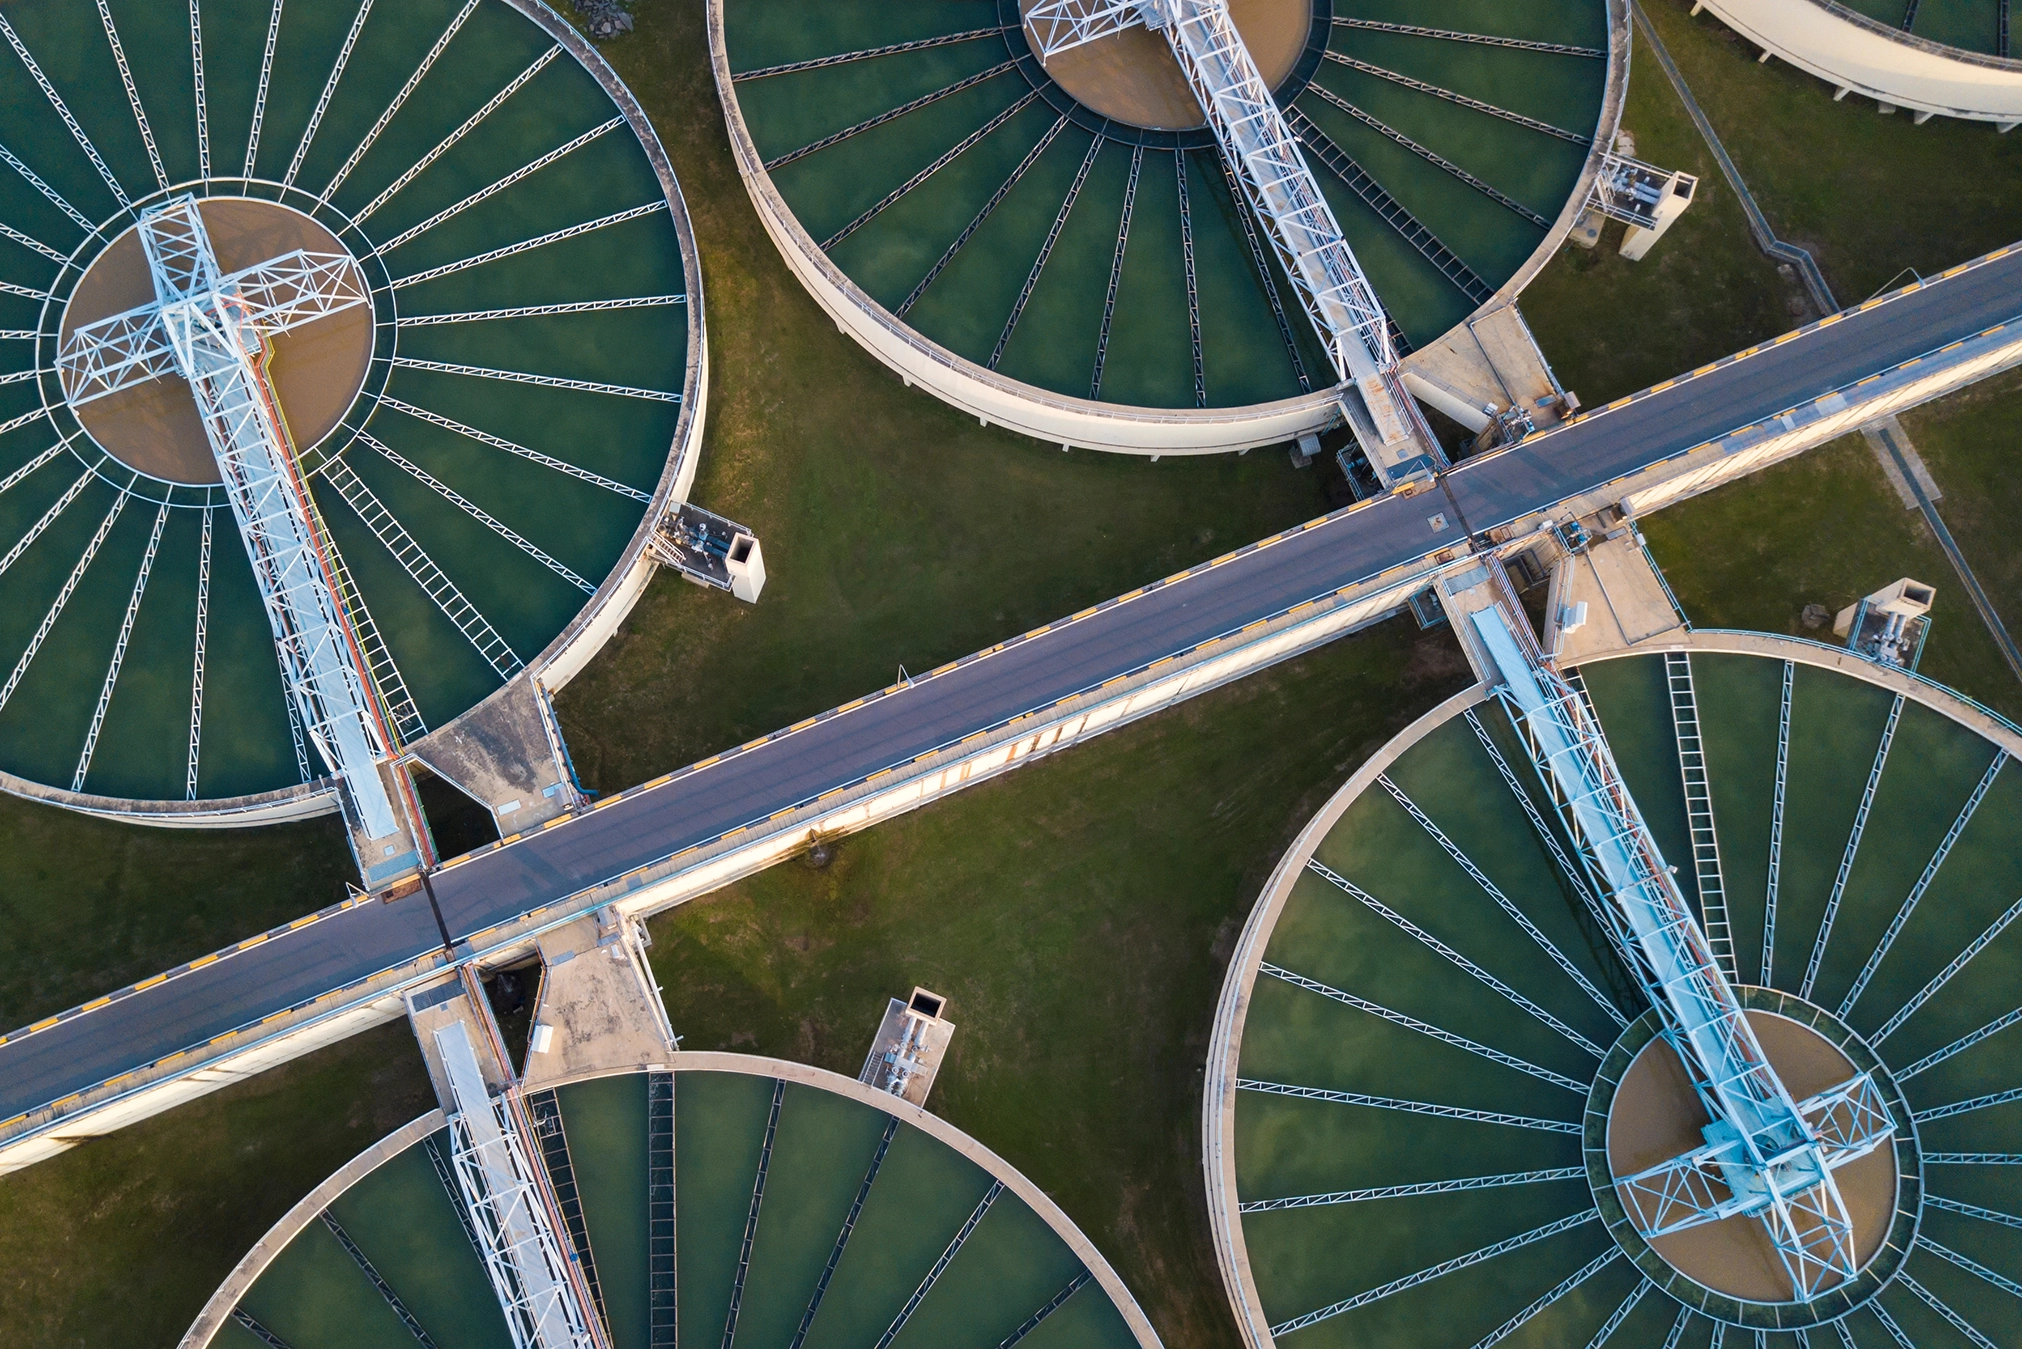
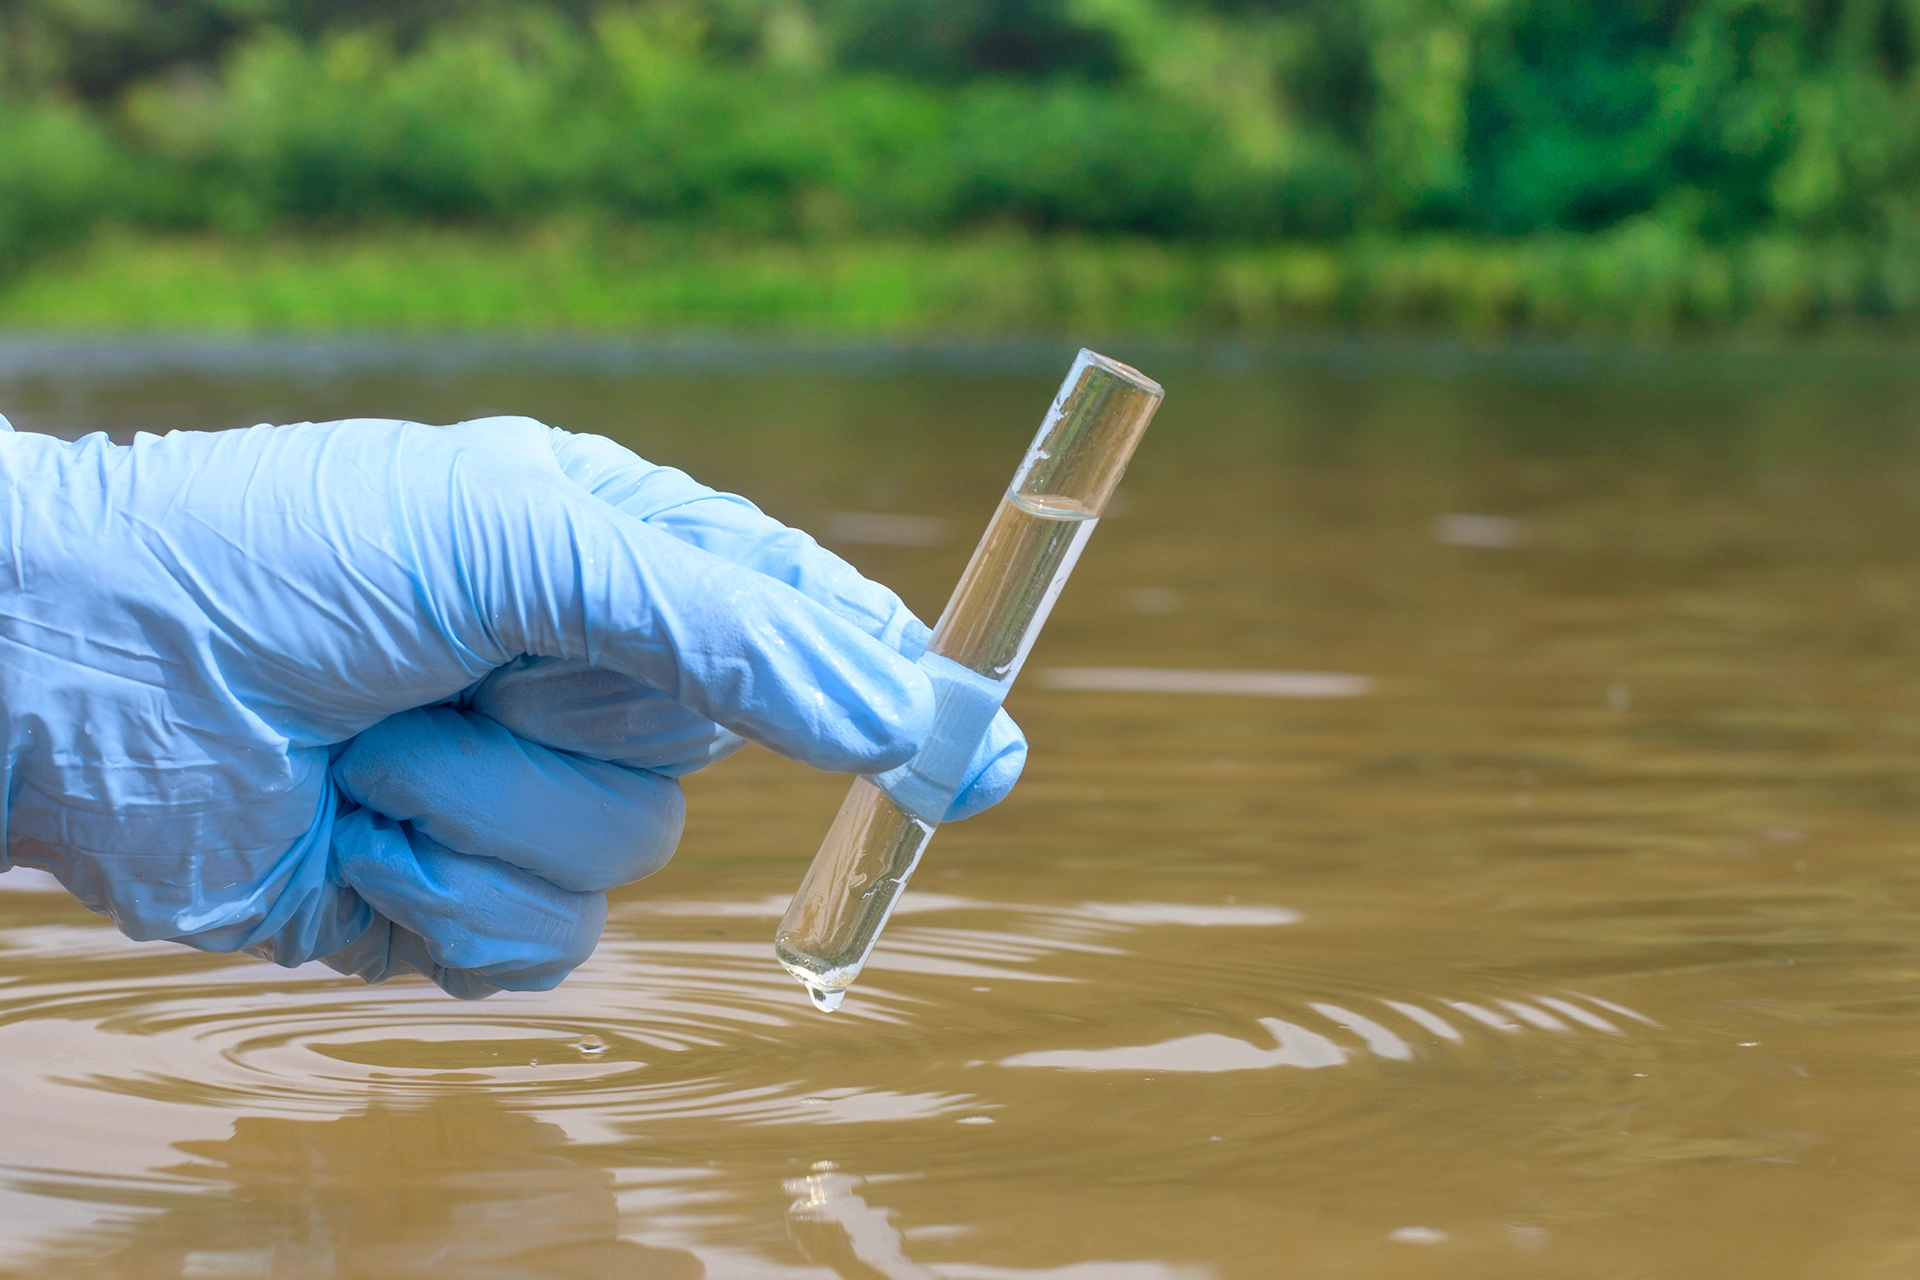
Waste is generated from our operations, both in the form of physical materials waste from our end to end supply chain activities and effluent waste water and sludge generated from our wet processing activities.
Recognising these two different forms of waste output from our business, we have elected to pull both of these important focal areas under a revised Sustainability Pillar which we will now refer to as our Waste Pillar. Our Environmental Policy covers our aims and objectives around waste.
In our next strategy period from 2023 until 2026, our primary focus for materials waste will be elimination of waste to landfill across all units globally. Our target for 2026 is delivery of zero waste to landfill, and this will be achieved by higher granularity analysis of waste streams which today continue to be diverted to landfill, with improved segregation and identification of opportunities for circularity, recycling and reuse.
Reducing materials usage and minimising the impact of the materials that we consume is a very high priority for us. In 2019, we adopted the European Union’s Waste Framework Directive as our basis for waste management and the resulting waste catalogue contains 35 different waste categories that cover all material items present in a Coats unit. This gives increased transparency and understanding of waste generation streams across our business, and assists us in identification of opportunities for reduction, and where possible, prevention.
Our strategy for reducing overall waste, is to prioritise reduction in its generation through process and product redesign, followed by implementation of reuse and recycling initiatives. We are committed to increase the degree of circularity at Coats, evolving our manufacturing processes, material flows and products from a linear (take, make, discard) to a circular (reduce, reuse, recycle) model.
During 2022, the total waste generated across Coats business units was 14.6 thousand tonnes, compared with 22.5 thousand tonnes in 2021. Analysis of waste generated in 2022 shows that 19% of waste material from our operations is linked directly to our products, with other high volume categories including paper, cardboard and wood packaging 18%, sludge 27% and plastic packaging 10%. Of our waste generated, 62% was recycled or reused, with 13% disposed of in landfill (this is down from 14% in 2021 and 19% in 2020). Globally, 58% of our units have achieved sending zero waste to landfill through 2022.
As per our 2019 to 2022 sustainability strategy, our target for waste reduction in 2022 was delivery of a 25% reduction in the percentage of waste generated from our 2018 baseline. Against this target, we are exceptionally proud to have fully achieved this target with a full 25% reduction delivered – a significant improvement from the 1.4% reduction reported for 2021.
Considerable progress was made throughout the year in working collaboratively with our supply chain partners to identify and implement new waste reduction and circularity initiatives. Examples of circularity on packaging materials have entailed us working closely with strategic suppliers where uplift programs have been instituted on our paper and cardboard waste, enabling it to be repulped and reconstituted into new paper and cardboard packaging materials. With plastic, many of our units now grind thermoplastic dye centres and customer returned thread supports into plastic chips and return these to suppliers enabling their melting and reformation into new plastic items. We have implemented tripartite service agreements with our primary chemical suppliers and a network of global specialist collection players, enabling recovery of empty chemicals drums and plastic intermediary bulk containers and redistribution to our suppliers for their reuse.
In our recently acquired footwear components business, structural components made from thermoplastic or cellulosic materials are supplied to the customer in a ‘sheet’ from which customers cut out parts which undergo secondary processing. This creates up to 20% waste, which is taken back by Coats to remelt/recycle.
Significant progress has also been made in reducing the packaging we supply with our products when shipped to customers. We have strategically eliminated use of plastic sleeves across black and dark coloured thread cones , resulting in elimination of 14.2 million plastic sleeves from our value chain, and have advanced the use of recycled plastic in cones and vicones, increasing recycled plastic use by 36% in 2022.
|
2022 Solid Waste Management
|
Non-hazardous Waste | Hazardous Waste | Total Waste |
|---|---|---|---|
|
Tonnes to landfill
|
1,354 | 605 | 1,959 |
|
Tonnes recycled/reused
|
8,348 | 706 | 9,054 |
|
Tones incinerated
|
672 | 1,139 | 1,811 |
|
Total Tonnes
|
10,875 | 3,729 | 14,604 |
|
Waste %
|
3.8% | 11.0% | 14.8% |
Zero Discharge of Hazardous Chemicals
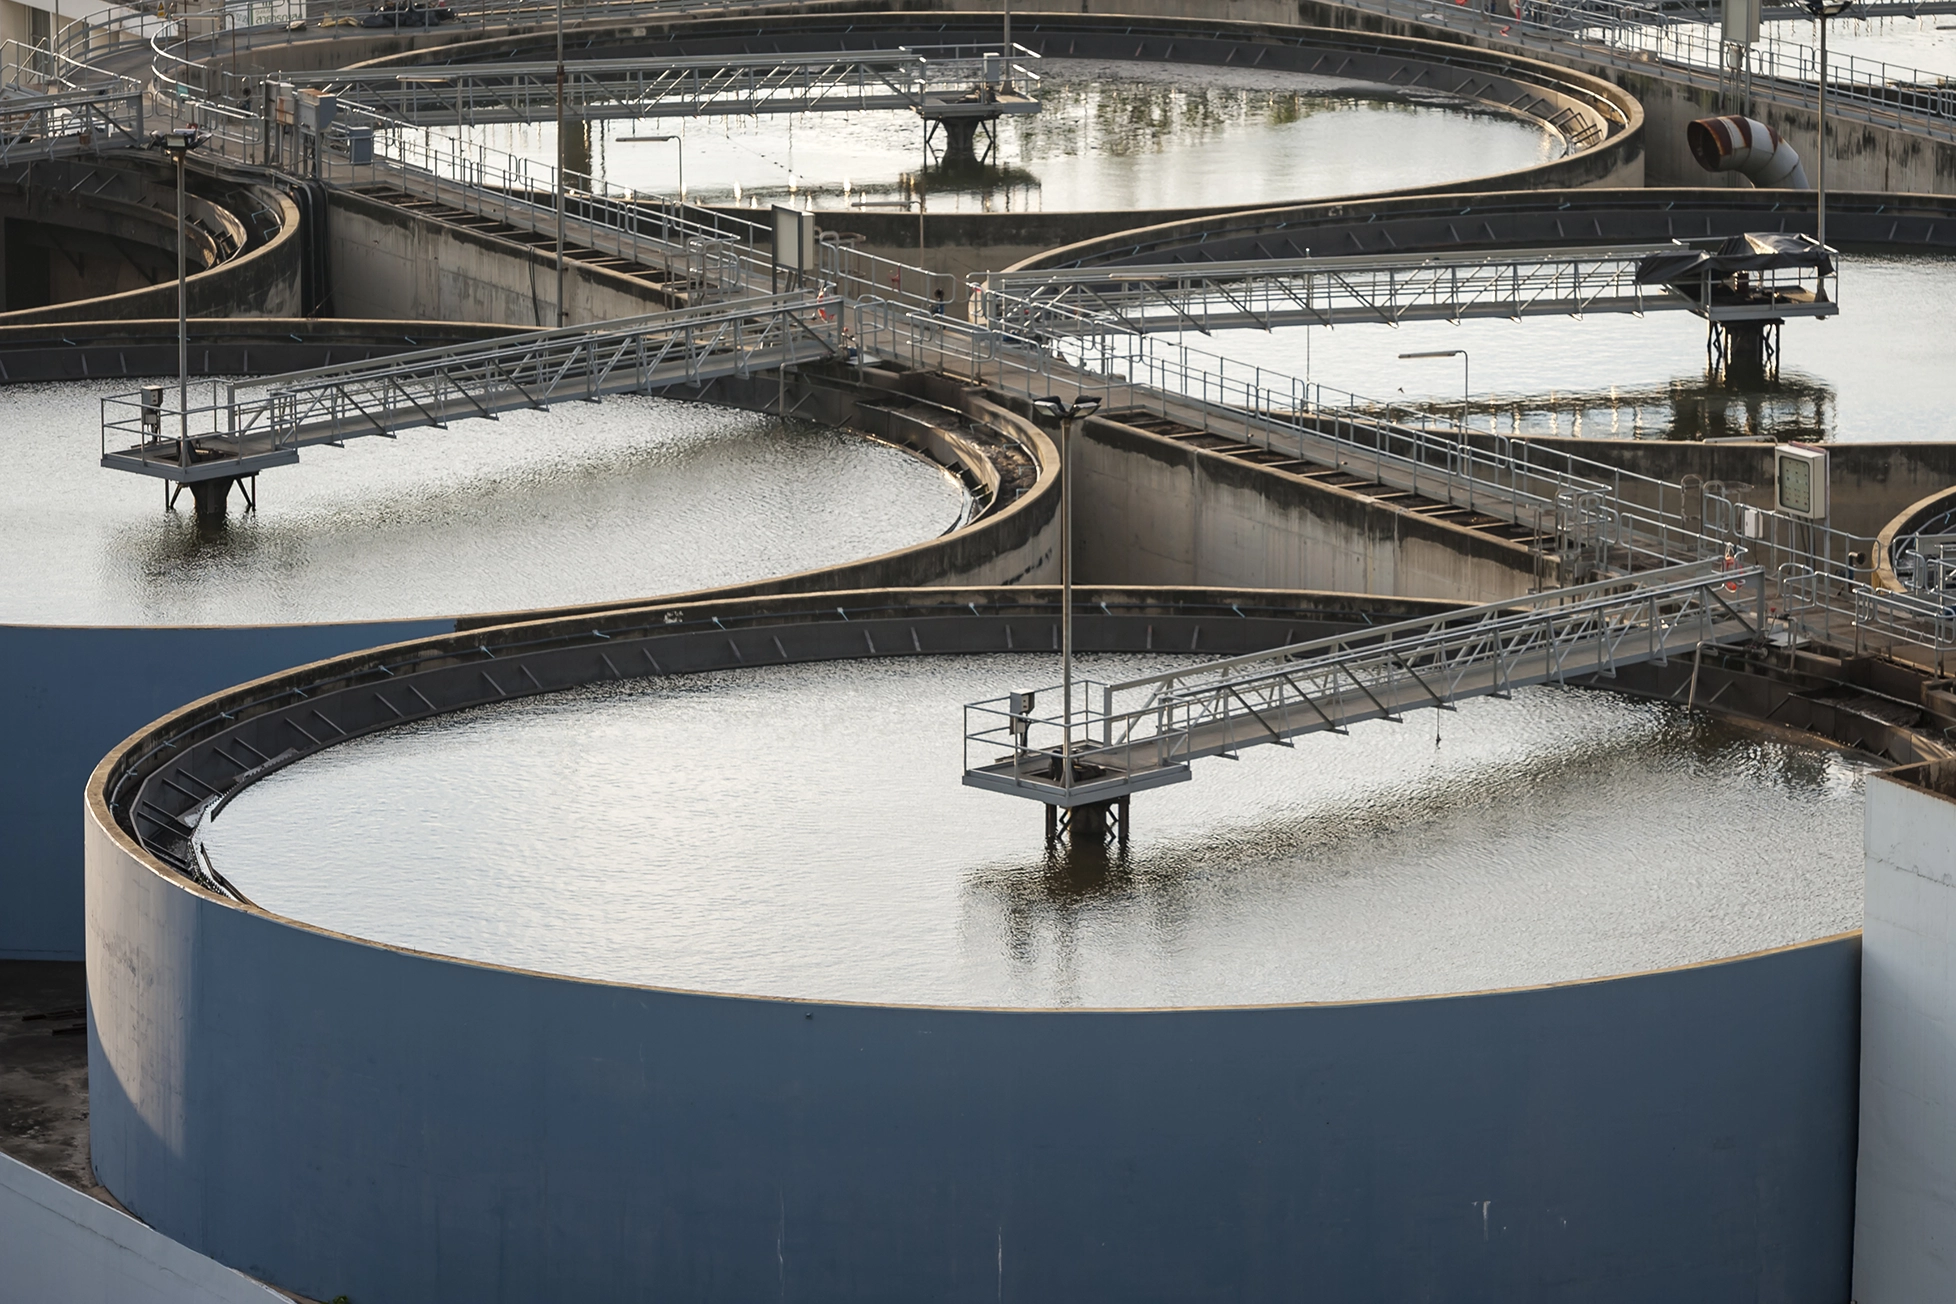
Modern Effluent Treatment
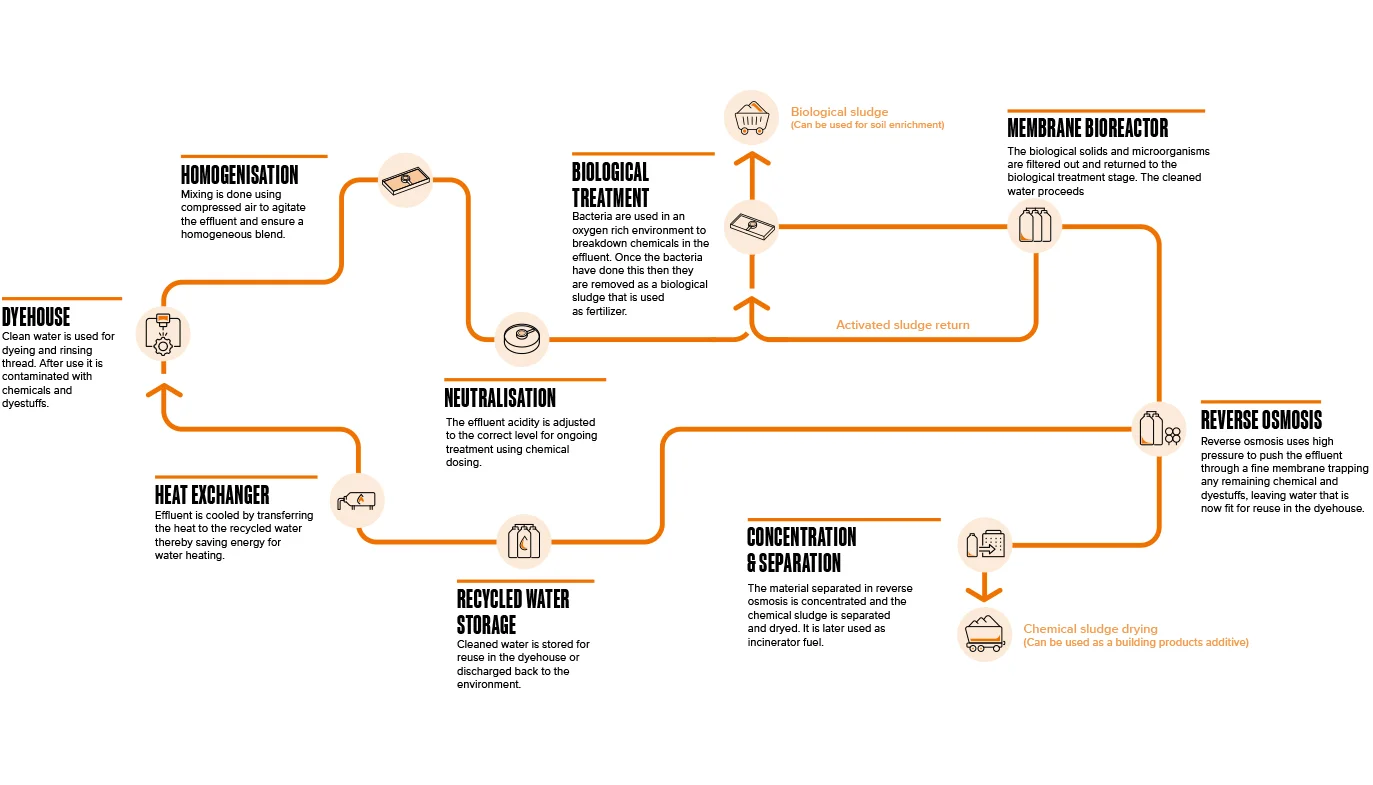
Waste: 100% all effluent to meet ZDHC limits
|
Indicator
|
Unit | 2022* | 2021 restated1 | 2021 | 2020 restated1 | 2020 | 2019 restated1 | 2019 | 2018 restated1 | 2018 |
|---|---|---|---|---|---|---|---|---|---|---|
|
% of water discharged as effluent
|
% | 76% | 68% | 68% | 68% | 69% | 62% | 61% | 65% | 65% |
|
Treated effluent discharge to surface water course
|
Million cubic metres | 2.5 | 3.0 | 3.0 | 2.7 | 2.7 | 3.2 | 3.2 | 4.1 | 4.0 |
|
Effluent discharge to offsite treatment plant
|
Million cubic metres | 0.9 | 1.1 | 1.2 | 1.0 | 1.1 | 1.3 | 1.3 | 1.1 | 1.3 |
|
Total effluent discharge
|
Million cubic metres | 3.4 | 4.1 | 4.2 | 3.7 | 3.8 | 4.5 | 4.5 | 5.2 | 5.3 |
|
Environmental prosecutions
|
No. | 0 | 0 | 0 | 0 | 0 | 0 | 0 | 0 | 0 |
|
% effluent that is compliant with ZDHC
|
% | 92% | 82% | 82% | 74% | 74% | 63% | 63% | ||
|
Investment in effluent treatment plants and technology
|
Million $ | 1.5 | 2.2 | 2.2 | 1.5 | 1.5 | 4.6 | 4.6 | ||
|
Total waste generated
|
Tonnes | 14,604 | 22,530 | 23,425 | 17,558 | 18,499 | 24,207 | 25,322 | 23,072 | 24,288 |
|
Hazardous
waste generated8 |
Tonnes | 3,570 | 5,754 | 5,868 | 4,074 | 4,031 | 7,905 | 8,171 | 6,924 | 7,150 |
|
% total material waste
|
% | 14.8% | 19.4% | 19.6% | 19.0% | 19.4% | 21.1% | 21.4% | 19.7% | 20.2% |
|
% movement in waste % compared to 2018
|
% movement | -25% | -1% | -3% | -3% | -4% | 7% | 6% | ||
|
Reused or recycled waste
|
% of waste | 62% | 67% | 67% | 61% | 62% | 67% | 67% | 69% | 69% |
|
Waste going to landfill
|
Tonnes | 1,959 | 2,977 | 3,532 | 3,700 | 3,060 | ||||
|
% units sending zero waste to landfill
|
% | 58% | 46% | 45% | 49% | 47% | 58% | 65% | 61% |
1Due to the sale of our Brazilian and Argentinian businesses in 2022 all years from 2018 to 2022 have been restated to exclude these businesses.
*2022 Data – All data excludes Brazil/Argentina, except emissions data, H&S data and economic value data.
8Hazardous waste includes all of the following categories: dyes, chemicals, solid and aqueous sludge, fuels, oils, toner cartridges, hazardous packaging waste, hazardous cleaning cloths, items containing CFCs, HCFCs & HFCs, batteries, inorganic waste, organic waste, laboratory waste, medical waste, construction materials containing asbestos, fluorescent tubes, paints, inks, adhesives, resins and electrical and electronic equipment.
For more information on our historical performance, please download Performance Summary Data
Waste: 100% all effluent to meet ZDHC limits
|
Indicator
|
Unit | 2017 | 2016 | 2015 | 2014 |
|---|---|---|---|---|---|
|
% of water discharged as waste effluent
|
% | 77% | 79% | 80% | 87% |
|
Effluent discharge to offsite treatment plant
|
Million cubic metres | 1.4 | 1.4 | 1.6 | 1.5 |
|
Total effluent discharge
|
Million cubic metres | 6.2 | 6.4 | 6.5 | 6.9 |
|
Environmental prosecutions
|
No. | 0 | 0 | 0 | 0 |
|
Investment in effluent treatment plants and technology
|
Million $ | 2.2 | 1.6 | 0.9 | 3.4 |
|
Reused or recycled waste
|
% of waste | 76% |
For more information on our historical performance, please download Performance Summary Data