
Our approach
Our economic contribution
Coats is a global business manufacturing industrial sewing threads and zippers.
Through our activities, we make an economic contribution that stretches far beyond the boundaries of our own operations: we buy from local, regional and global suppliers; this is evident through the wages we pay our employees; and as we pay interest to financial institutions and taxes and remittances to governments.
We are economically linked with the local communities in which we operate and the markets that we serve around the world. As our business grows, then so does the positive economic contribution we make.
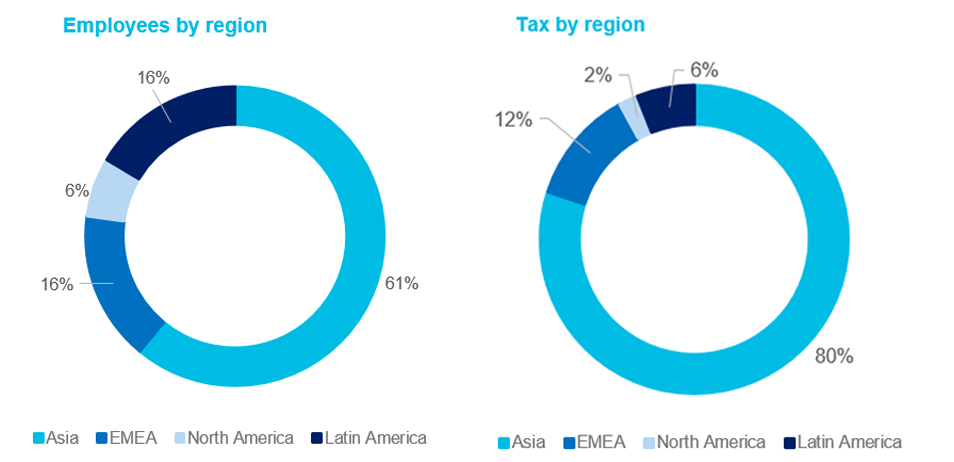
During the year ending December 31, 2018, we employed over 18,000 people across more than 50 countries and sourced goods from even more countries worldwide. In the year ended December 31, 2018, Coats Group PLC generated $1,542.6 million of economic value, of which the majority was distributed to our suppliers (62%) and employees (22%). A further 4% was paid in taxes to local and national governments. The following charts illustrate the regional distribution of our employment and tax payments during 2018:
Taxation paid
During the year the Group made Corporate Income Tax payments in respect of continuing operations (including withholding and dividend distribution taxes) of $51.4m (2017: $55.9m).
The amount of tax paid in each jurisdiction is as follows:
|
2018 |
2017 |
|
|
$'m |
$'m |
|
|
UK (1) |
11.5 |
7.1 |
|
Vietnam |
11.0 |
9.7 |
|
India |
7.0 |
10.9 |
|
Indonesia |
5.7 |
7.1 |
|
Turkey |
3.0 |
1.7 |
|
Pakistan |
1.9 |
0.3 |
|
Bangladesh |
1.6 |
1.6 |
|
China |
1.4 |
1.1 |
|
Singapore (1) |
1.3 |
3.8 |
|
Mexico |
1.1 |
1.7 |
|
Colombia |
1.1 |
1.8 |
|
Hong Kong |
0.7 |
0.3 |
|
Egypt |
0.6 |
0.0 |
|
Thailand |
0.5 |
0.4 |
|
Romania |
0.4 |
0.5 |
|
Spain |
0.3 |
0.8 |
|
Argentina |
0.3 |
1.4 |
|
Germany (1) |
0.3 |
1.3 |
|
USA |
(0.2) |
2.4 |
|
Others (18 countries each less than $0.5m) |
2.0 |
2.0 |
|
Total corporate income tax paid |
51.4 |
55.9 |
(1) The taxes paid in the UK, Singapore and Germany are primarily withholding taxes on royalties, group charges and dividends, deducted and paid at source in the following jurisdictions:
|
2018 |
2017 |
|
|
$'m |
$'m |
|
|
India |
1.8 |
2.1 |
|
Bangladesh |
1.8 |
0.9 |
|
Indonesia |
1.8 |
3.3 |
|
Vietnam |
1.3 |
0.4 |
|
China |
1.1 |
0.8 |
|
Thailand |
0.6 |
0.1 |
|
Pakistan |
0.6 |
0.3 |
|
Colombia |
0.6 |
0.4 |
|
Turkey |
0.4 |
0.8 |
|
Sri Lanka |
0.2 |
0.5 |
|
Others (each less than $0.5m) |
2.6 |
2.8 |
|
Total withholding taxes paid |
12.8 |
12.2 |
Direct economic value generated
| 2018 | ||
|---|---|---|
| $m | % | |
| Direct economic value generated | 1,542.6 | 100% |
| Economic value distributed | ||
| Operating costs | ||
| (before exceptional items and excluding depreciation and amortization and employee remuneration) | 959.1 | 62% |
| Employee remuneration | ||
| (wages, salaries, social security and other pension costs) | 335.5 | 22% |
| Providers of capital | ||
| (interest payable on bank loans, overdrafts and other borrowings and dividends payable to external shareholders) | 37.0 | 2% |
| Payments to governments | ||
| (taxes payable in respect of taxable profit and remittances) | 52.9 | 4% |
| Other net utilizations | 121.1 | 8% |
| Economic value retained / (losses for the year absorbed) | 37.0 | 2% |
Note: These figures are extracted from the Coats Group plc Annual Report 2018 and have been prepared in accordance with guidance provided by the Global Reporting Initiative (GRI EC1), which can be downloaded here
For more information on our historical performance download our full data disclosure.
For more information on our tax strategy please refer to our Corporate Tax Strategy Statement.

Stay updated on ways we can help your business – with thought leadership, product launches and trends
Contact Us
Thank you for your enquiry. A Coats representative will get in touch with you shortly.